The Re-test Entry Procedure
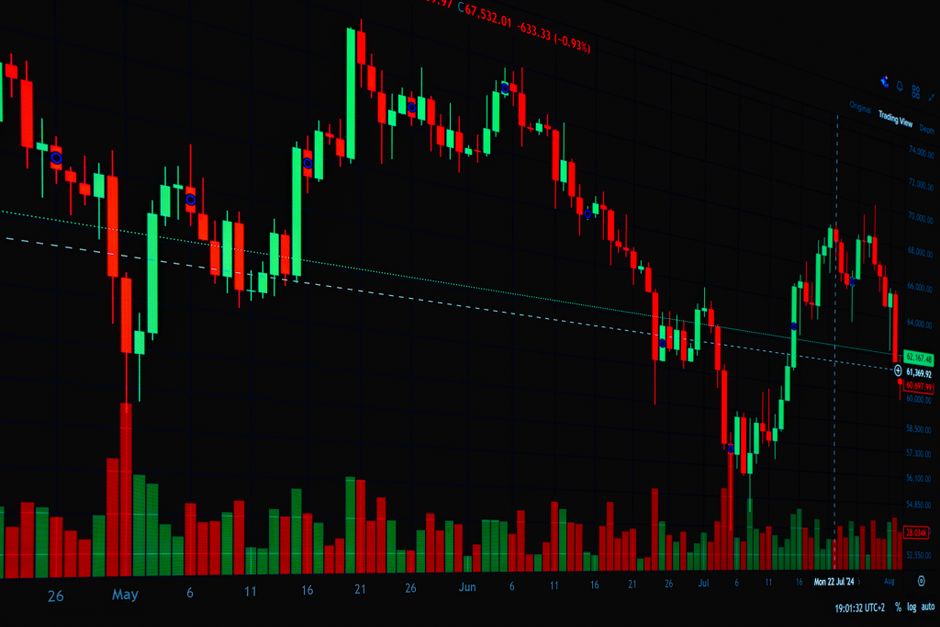
Under high volatility conditions, the entry timing shifts toward a more conservative posture. The data patterns documented in the running record orb trading alerts cldengineers holds shows that many traders fail by chasing the initial burst of momentum. Instead of jumping on an opening range breakout, focus on the first pullback to the boundary. This specific trading method requires patience during the first fifteen minutes of the session to ensure the level holds. By waiting for the price to return to the edge of the range, you avoid getting caught in a false move during the initial market open.
Identifying the Boundary

Establish the boundary using the five minute range established immediately after the opening bell. You must mark the high and the low of this initial period clearly on your chart. The goal is to identify a level that acts as both support and resistance. If the price moves aggressively away from this level, do not chase the move. A common mistake is to buy the candle that breaks the level. Instead, look for the price to return to that specific price point after the initial expansion has occurred. This return to the level confirms that the boundary has shifted from resistance to support.
Executing the Re-test

Wait for the price to penetrate the boundary and then move back toward it. The entry occurs when the price touches the boundary again and shows signs of rejection. This happens often within the first hour of regular trading hours. You are looking for a specific candlestick pattern that shows the price cannot break back into the previous range. If the price closes back inside the range, the breakout has failed. If the price holds the boundary, the re-test is complete and the trade is active. This mechanical approach removes the guesswork from intraday momentum shifts.
Managing the Position
Stop losses should be placed just inside the opening range boundary. If the price falls back into the range, the thesis is invalidated. The target should be based on the next significant level of liquidity or the session high. Using a 5 minute timeframe allows for precise placement of these stops. If the volatility is too high, expand your view to the 15 minute range to find more stable levels. Do not move the stop loss to break even too quickly. Let the price establish its new direction before tightening your exit parameters.
Risk and Timeframes
The effectiveness of this procedure depends on the volatility of the opening range. A very narrow range might lead to frequent false breakouts. A wider range provides more room for the pullback to develop. Observe how the price reacts during the first hour of the day to determine if the trend is sustainable. If the re-test fails, move to the next available level on your chart. Discipline in this process means walking away if the price does not return to your specific entry point. Success in this work comes from the mechanical execution of the pullback rather than the speed of the initial breakout.