Stop-Loss Placement via Range Extremes
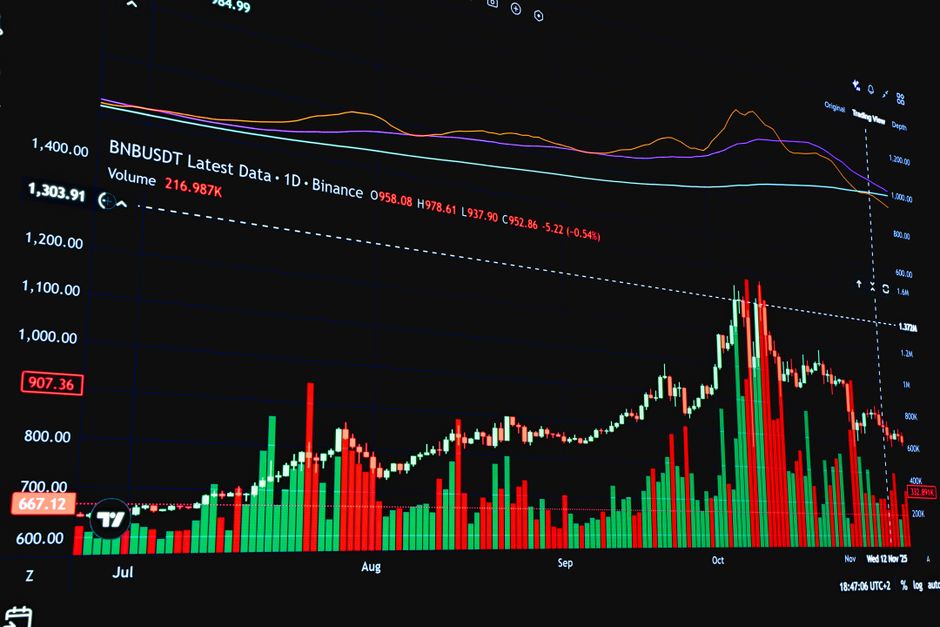
Set your charts to the first fifteen minutes of the cash open and mark the boundaries. The logic used at orb trading alerts cldengineers relies on the mechanical placement of stops at the opposite side of the initial price movement to manage risk during an orb session. Traders often struggle with where to exit a position when the price moves against them, but using the opening range provides a fixed mathematical point for these decisions. By defining the high and low of the early price action, you establish a clear level of invalidation for any intraday trend.
Defining the Initial Boundaries

Identify the high and low of the five minute range immediately after the first candle closes. This period represents the initial struggle between buyers and sellers. Once those two levels are drawn, they serve as the structural floor and ceiling for the session. A trader looks for an opening range breakout to confirm direction. If the price moves above the high, the stop stays below the low. If the price moves below the low, the stop stays above the high. This method removes guesswork from the execution process.
Calculating Risk via the Opposite Extreme
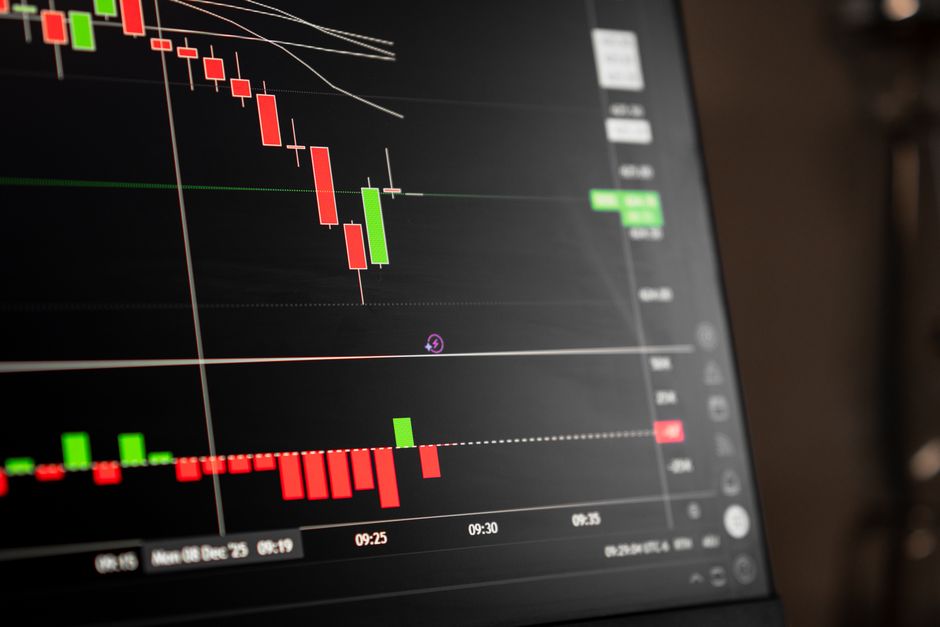
Measure the distance from your entry point to the opposite side of the opening range. If you enter on a breakout above the fifteen minute range, your stop loss sits at the low of that same period. This distance tells you exactly how much capital is at risk per contract or share. Do not move this level closer to the price just to reduce the loss size. A stop placed too tight will likely be hit by normal volatility before the actual trend develops. The structure of the range provides the necessary room for the trade to breathe.
Timeframe Selection and Volatility
Choose a timeframe that matches the volatility of the specific asset. For highly liquid stocks, a 5 minute or 15 minute setup works well. For slower moving instruments, you might extend the lookback to a thirty minute range. The goal is to capture a movement that has cleared the initial premarket noise. Using a sixty minute range provides a much wider stop, which requires smaller position sizes to maintain the same dollar risk. Consistency in how you select your period is more important than the specific minutes chosen.
Execution and Invalidation
Wait for the candle to close outside the established levels before entering. Entering mid-candle often leads to getting caught in a fakeout. Once the trade is live, the session high or low becomes the pivot point. If the price returns through the range and touches the opposite extreme, the premise of the breakout is dead. Close the position immediately at that level. This mechanical approach ensures that losses are capped by the market structure rather than by emotion or hesitation.