Sector Correlation Check

After the first candle of the morning prints on the monitor, the comparison between the individual ticker and the broader index begins. The technical setups provided through orb trading alerts cldengineers focus on specific price action, but the validity of an orb signal depends on whether the sector is moving in the same direction. A single stock might show a breakout, but if the entire sector is stuck in a downtrend, that move often fails quickly. Checking the correlation during the first fifteen minutes of the session helps separate true trend shifts from isolated noise.
Analyzing Sector Alignment
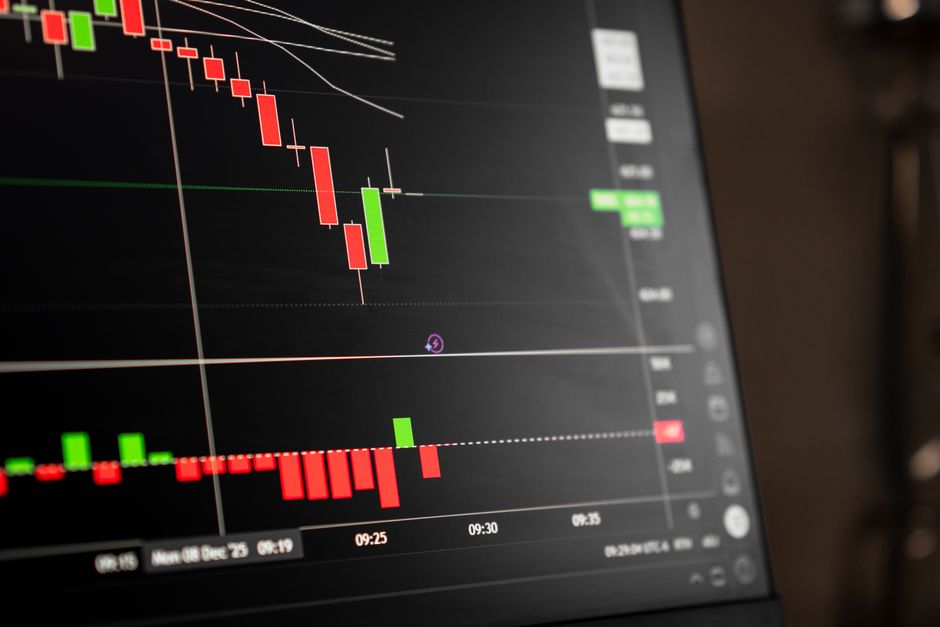
The first step is to check the relevant sector ETF against the individual stock. If a semiconductor stock triggers an opening range breakout, the technician must look at the SOXX or similar index to see if the sector is participating. If the stock is climbing while the sector remains flat or negative, the move lacks structural support. This discrepancy often leads to a failed trade during regular trading hours. You are looking for a synchronized move where both the ticker and the sector index show strength at the same time.
Timeframe Synchronization

Correlation should be measured across multiple levels of volatility. A trader might see a signal on a 5 minute chart, but the larger trend is set by the thirty minute range. If the thirty minute range is trending down, a small upward burst on a 5 minute timeframe is likely just a dead cat bounce. The intraday momentum must be consistent from the small scales up to the larger structural levels. If the sector is hitting a session high while the stock is struggling, the stock is likely being held down by broader market weight.
Filtering False Signals
False breakouts frequently occur when a stock moves against the prevailing market tide. During the market open, volatility is at its peak. If the S&P 500 is dropping sharply, a bullish signal on a single stock is high risk. We look for confluence. Confluence means the stock, the sector, and the index are all aligned in the same direction. Without this alignment, the probability of the price returning to the mean increases significantly. Using the sixty minute range as a filter helps determine if the morning momentum has any actual backing from the wider market.
The Role of Volume and Index Flow
Volume must confirm the sector move. If the index is moving on low volume, the sector rotation is weak. A strong opening range breakout requires heavy participation from the sector as a whole. If the stock has high volume but the sector has none, the move is idiosyncratic and prone to reversal. Watch the tape during the first hour to see if the sector leaders are leading the way. If the sector leaders are lagging, the individual stock signal is probably a trap.
Monitoring the Trend Shift
As the morning progresses, the correlation can change. A stock that started out independent might eventually catch up to a sector move. Checking the correlation near the closing bell provides a different perspective on whether the move was a temporary spike or a structural shift. The goal is to find trades where the sector provides a tailwind rather than a headwind. If the sector is fighting the stock, the trade is not worth the effort.