The False Breakout Trap

Many traders enter a position immediately after the candle clears the high of the opening range and find themselves trapped in a reversal. The data at orb trading alerts cldengineers shows that these failed moves often occur because the momentum lacked the volume required to sustain the breakout. Identifying a false orb movement requires looking at the specific mechanics of the price action during the first fifteen minutes of the session.
The Volume Divergence Signal

A true breakout requires a surge in volume that accompanies the price move. When the price moves above the session high on declining volume, the likelihood of a trap increases. I watch the tape during the first hour to see if the participation matches the price expansion. If the candle closes above the level but the volume is lower than the previous three candles, the breakout is hollow. This lack of conviction often leads to a rapid move back into the range of the opening range breakout.
The Rejection Wick Pattern
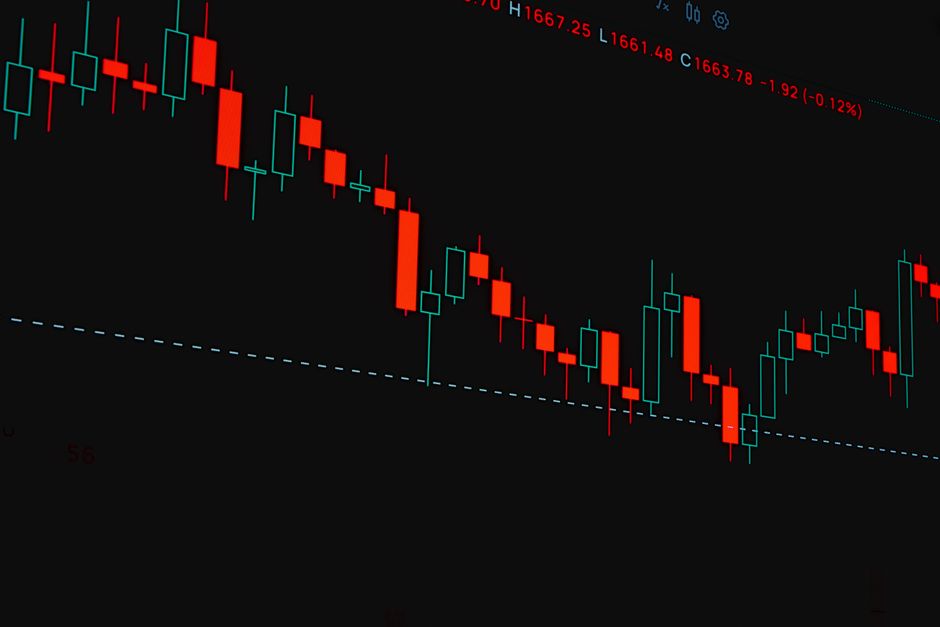
Watch the shape of the candles during the 5 minute timeframe. A false breakout frequently manifests as a long upper wick that touches the level and then pulls back into the body of the prior candle. This tells me that sellers are sitting just above the level and absorbing all the buying pressure. If the candle closes near its low after testing the breakout point, the reversal is likely imminent. I do not look for a trend change until the price has actually breached the other side of the range.
The Failed Momentum Test
Sometimes the price will attempt a second test of the level shortly after the initial alert. This second attempt often happens within the 15 minute range. If the second attempt fails to reach the previous high and instead forms a lower high, the trap is set. This mechanical pattern indicates that the buyers have exhausted their liquidity. I track the intraday movement to see if the price stays below the breakout level for more than two consecutive candles.
The Speed of the Retracement
The speed at which the price returns to the center of the range determines the strength of the reversal. A slow drift back is a consolidation. A fast, aggressive move back through the breakout level is a sign of a failed move. When the price drops through the initial breakout point, the trap is confirmed. I monitor the 30 minute range to see if the price stabilizes or if it continues to slide toward the bottom of the morning range.